
¿Deberíamos esperar una ruptura o una recuperación del US Wall Street 30 Index?
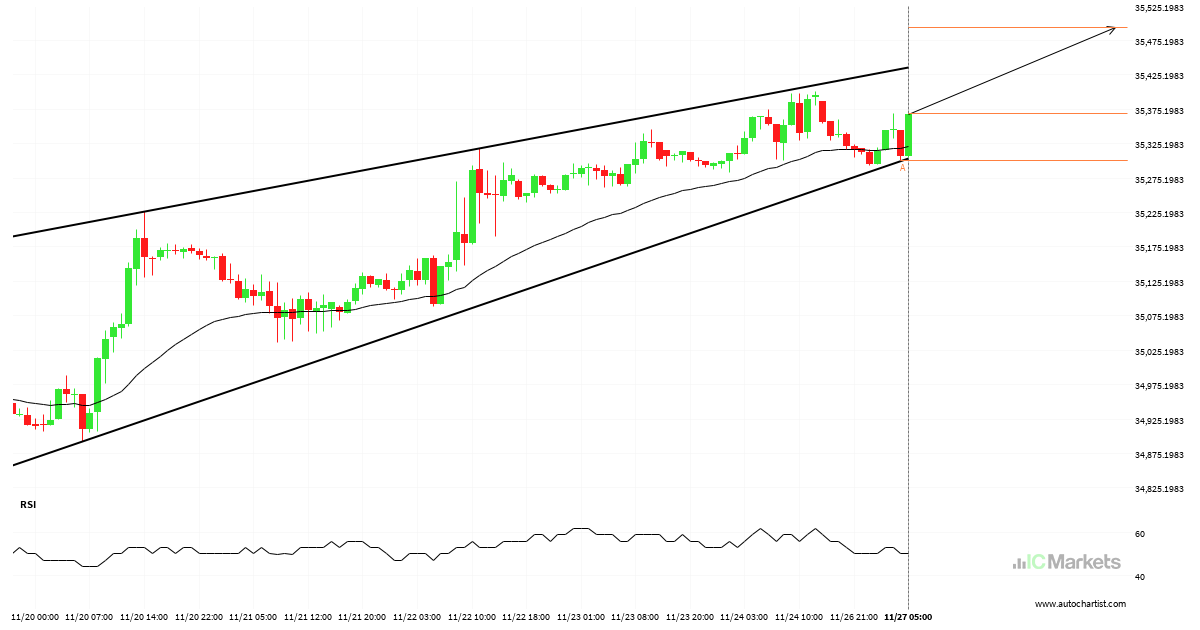
El US Wall Street 30 Index se dirige a la línea de resistencia de un Cuña ascendente. Si este movimiento se mantiene, el precio de US Wall Street 30 Index podría probar el nivel de 35493.4407 en las próximas 2 días. Ya ha probado esta línea en numerosas ocasiones, por lo que este movimiento podría […]
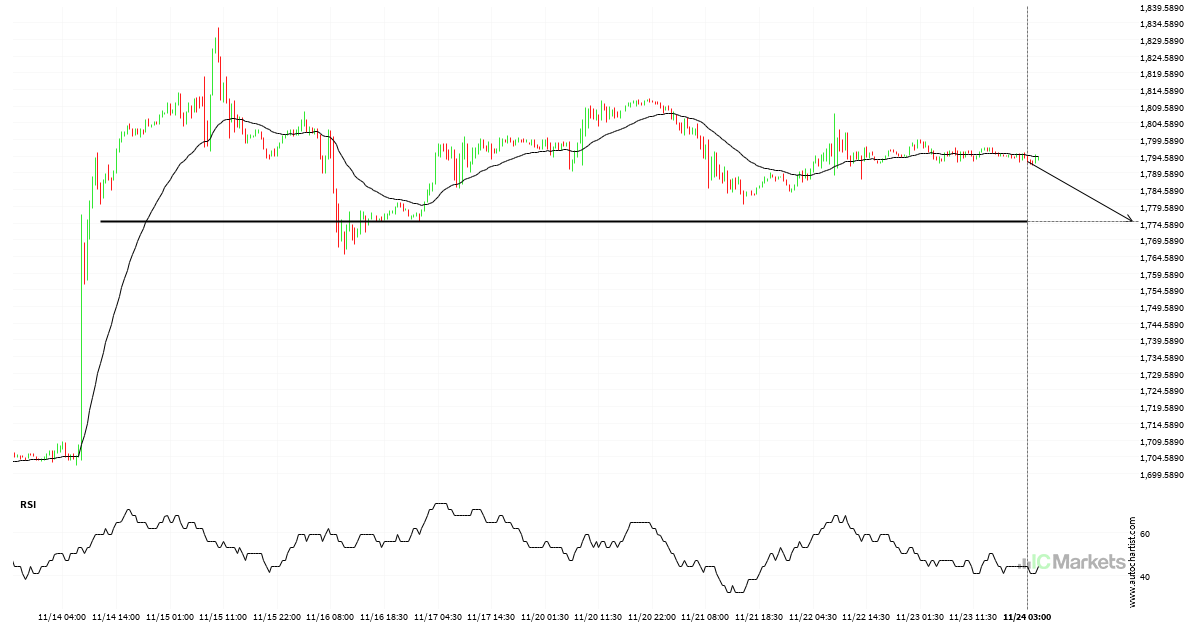
Un posible movimiento bajista en US Small Cap 2000 Index
El precio de US Small Cap 2000 Index ha vuelto a la zona de soporte. Es posible que tenga dificultades para atravesarla y que retroceda en la otra dirección. El precio eventualmente puede romper, pero normalmente el precio rebota en el nivel varias veces antes de hacerlo.

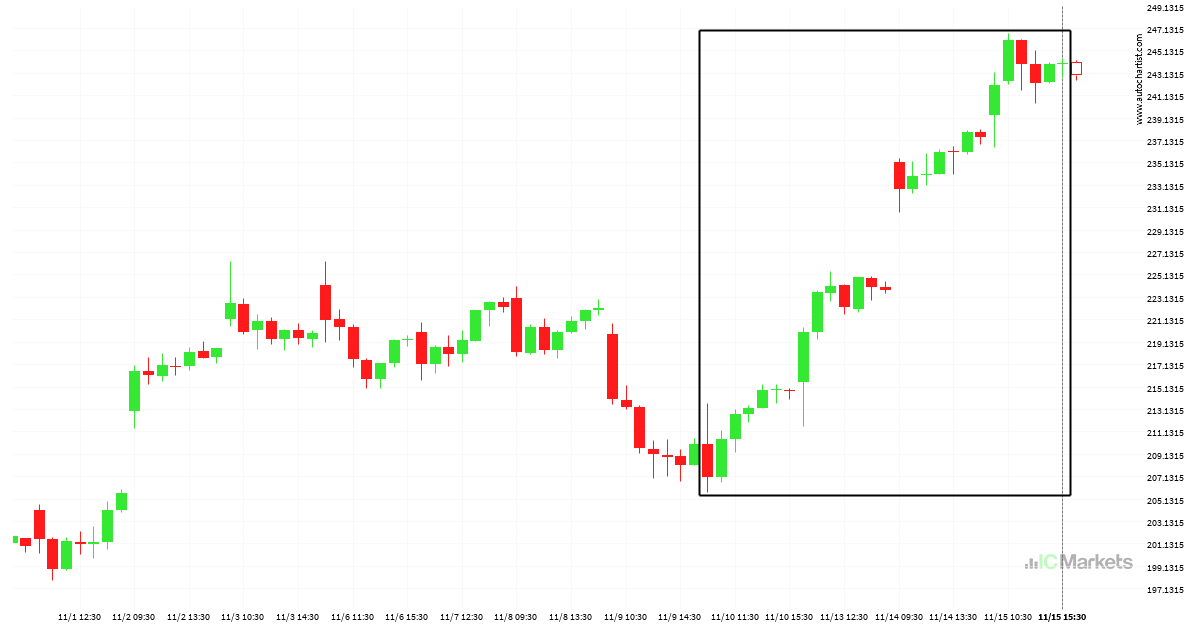
¿Qué está ocurriendo con el US Tech 100 Index?
US Tech 100 Index experimentó un movimiento extremadamente grande que duró 28. Este movimiento está en el percentil 95.0 y es poco común. No es inusual presenciar un retroceso después de un movimiento tan grande.
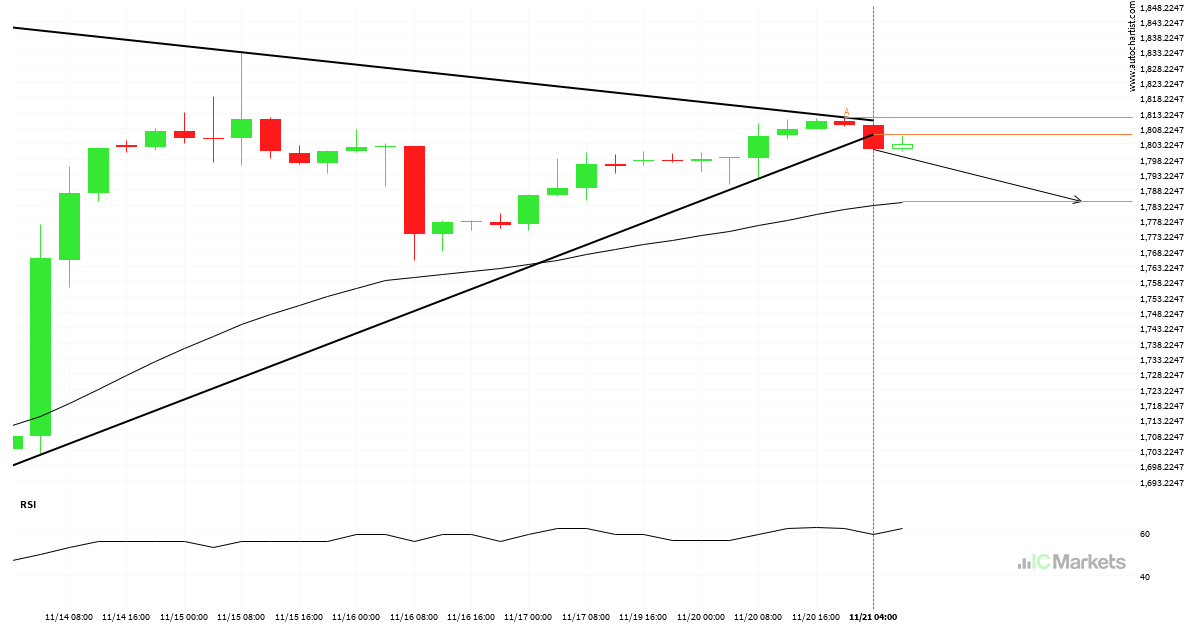
Rotura de Triángulo en US Small Cap 2000 Index
El US Small Cap 2000 Index ha atravesado una línea de soporte de un Triángulo y sugiere un movimiento posible a 1784.5263 dentro de las próximas 2 días. Ya ha probado esta línea en el pasado, por lo que deberíamos esperar la confirmación de esta irrupción antes de entrar en acción. Si dicha ruptura no […]
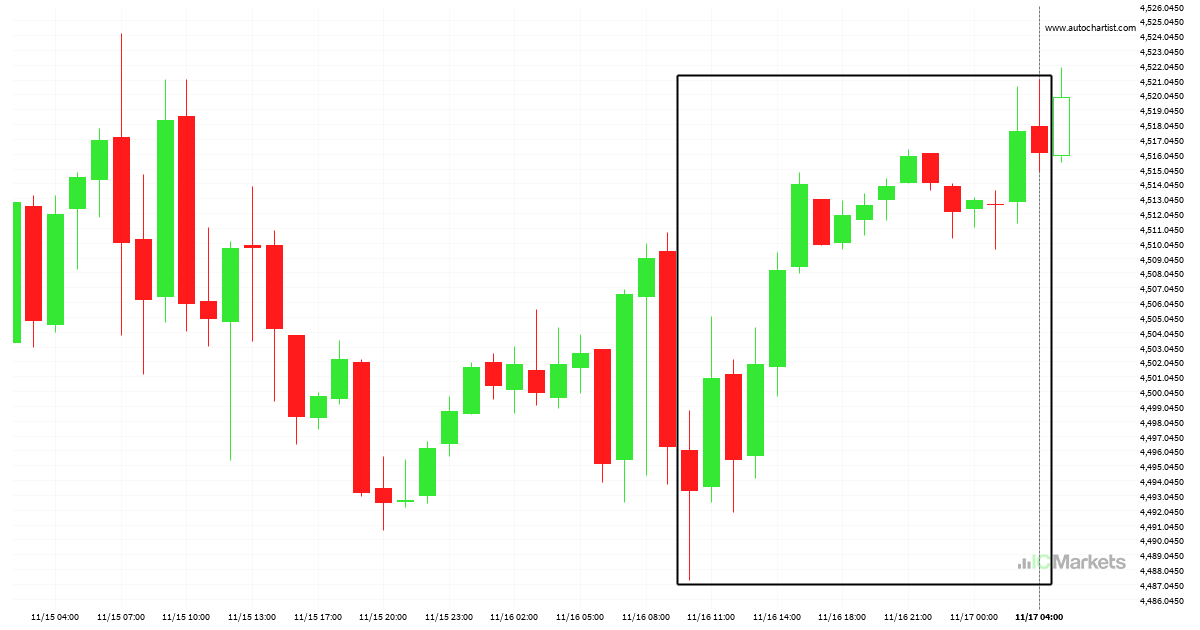
¿Se perdió este movimiento en US SPX 500 Index?
US SPX 500 Index experimentó un movimiento extremadamente grande que duró 18. Este movimiento está en el percentil 95.0 y es poco común. No es inusual presenciar un retroceso después de un movimiento tan grande.
Tesla Inc. se está moviendo, actúe ahora
Aquellos de ustedes que sean seguidores de tendencias probablemente estarán observando ansiosamente Tesla Inc. para comprobar si el último movimiento de un 17,88% continúa. Si no lo hace, las personas fieles al método de reversión a la media estarán encantadas con este excepcionalmente gran movimiento de 6 días.

¿Se perdió este movimiento en US SPX 500 Index?
Un movimiento de un 0,9% en 20 horas de US SPX 500 Index no pasa desapercibido. Puede empezar a considerar hacía donde se dirigirá ahora: si seguirá con la tendencia ascendente actual o volverá a la dirección anterior.
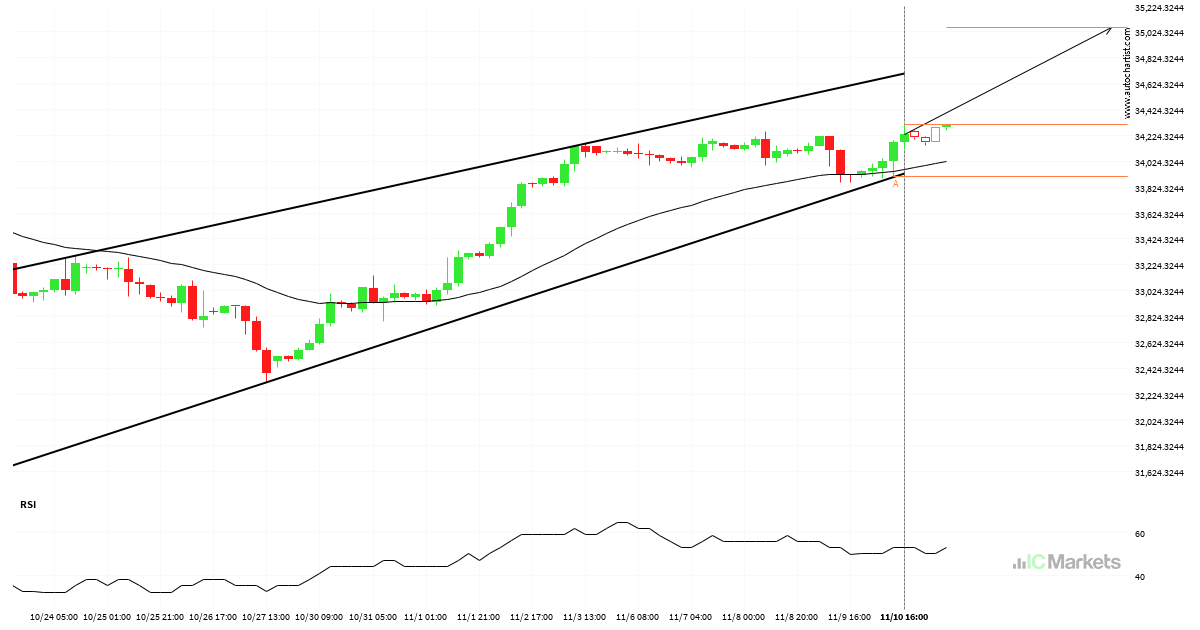
El US Wall Street 30 Index se aproxima a la resistencia de un Cuña ascendente
US Wall Street 30 Index se identificó alrededor de 34308.3 después de haber rebotado recientemente en un nivel de soporte en el intervalo temporal de 4 Hora. En última instancia, la acción del precio del activo ha formado un patrón de Cuña ascendente. Esta presión puede aumentar las posibilidades de una fuerte rotura. El movimiento […]
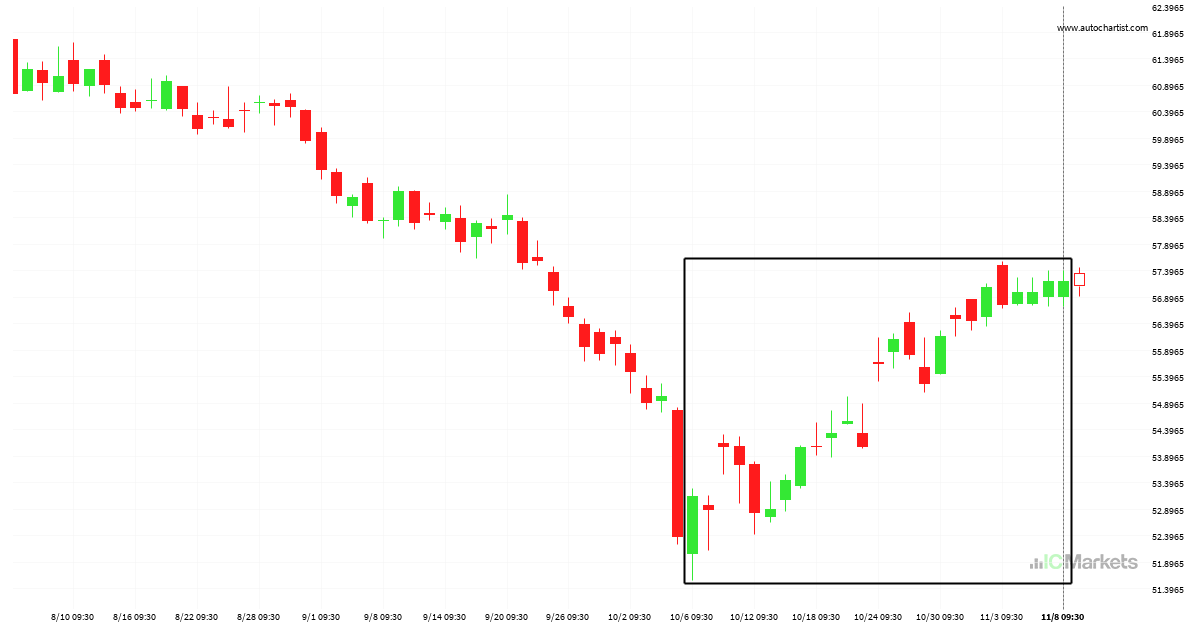
¿Hacia dónde se dirige el Coca-Cola Co.?
Se ha producido un gran movimiento inesperado en el gráfico de Diario de Coca-Cola Co. que comienza en 53.14 y finaliza en 57.19. ¿Es esto una señal de algo nuevo? ¿Qué podemos esperar en el futuro?
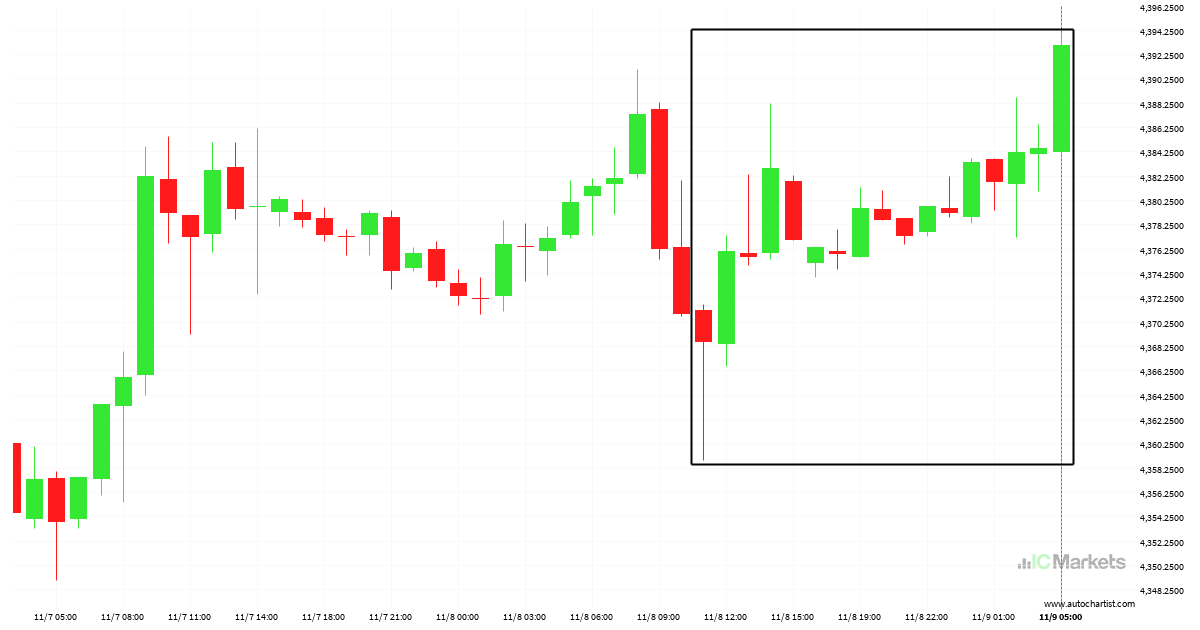
Gran movimiento en US SPX 500 Index, ¿se lo perdió?
US SPX 500 Index cayó bruscamente durante 18 Horas, que es un movimiento demasiado grande para este instrumento, superando el 98% de los movimientos anteriores del precio. Incluso si este movimiento es una señal de una nueva tendencia en US SPX 500 Index, existe la posibilidad de que seamos testigos de una corrección, por breve […]